
Fire Suppression Response Time Metrics That Signal System Gaps
TIME
Click count
For technical evaluators, fire suppression response time metrics are not just performance numbers on a test sheet. They are leading indicators of whether a protection system will actually control a fire fast enough to prevent escalation, asset loss, production interruption, and compliance exposure. In critical facilities, the most important question is rarely “Is the system installed?” but “How much delay exists between ignition, detection, decision, discharge, and effective control?”
That distinction matters because many system gaps remain invisible in static compliance reviews. A fire suppression system can satisfy design requirements on paper while still showing dangerous timing weaknesses under realistic operating conditions. When evaluators analyze response time data with enough granularity, they can detect reliability drift, installation flaws, zoning errors, control logic delays, hydraulic limitations, and environmental mismatches before those weaknesses become incident-level failures.
For organizations operating semiconductor fabs, battery lines, energy facilities, data-heavy industrial plants, or hazardous process areas, the practical value of response time analysis is straightforward. It helps determine whether a system is engineered for resilience, whether benchmark results are repeatable, and whether protective performance remains stable across the conditions that matter most in the field.
Why response time metrics matter more than a pass/fail result
Technical evaluators usually inherit a familiar problem. Suppliers, installers, and maintenance teams often present suppression systems as compliant if they activate within an accepted test envelope. But a binary pass/fail outcome is too blunt for high-consequence environments. It does not show where delay accumulates, how much variation exists between events, or whether the system remains dependable under heat load, airflow, occupancy mode, or process-state changes.
That is why fire suppression response time metrics are so useful. They transform a compliance snapshot into an engineering performance profile. Instead of asking whether the system worked once, evaluators can ask whether the sequence is consistently fast enough, where the bottlenecks are, and what margin remains before a controllable event becomes an uncontrolled one.
In practical terms, the most meaningful metric set is not a single number. It is a chain of timed events: detection latency, alarm verification delay, release authorization delay, valve or actuator response, agent travel time, and time to actual suppression effect. If one segment is unstable, the entire system may appear functional while still being operationally weak.
Which fire suppression response time metrics actually reveal system gaps
Technical evaluators should prioritize metrics that show sequence integrity, repeatability, and variance. The first is detection-to-alarm time. This indicates how quickly sensing devices identify a developing event and communicate it to the control architecture. In many facilities, this segment is affected by detector selection, placement density, airflow behavior, contamination, and threshold programming.
The second critical metric is alarm-to-release time. This often exposes hidden logic delays, interlock dependencies, verification routines, manual override requirements, and control panel processing bottlenecks. A system may detect rapidly but still lose valuable seconds because release logic was designed for nuisance alarm reduction rather than incident containment in a fast-escalation hazard zone.
The third is release-to-discharge time. This is where mechanical readiness becomes visible. Valve actuation, pressure integrity, pipe routing, nozzle obstruction, and agent condition all influence how quickly suppressant actually reaches the target area. In gaseous, water mist, foam, or hybrid systems, this phase often reveals maintenance-related degradation that routine visual inspections miss.
A fourth metric is discharge-to-control time, meaning the time between agent release and measurable suppression effect. This is especially important because fast discharge does not guarantee effective suppression. Poor nozzle geometry, incorrect agent concentration, ventilation interference, enclosure leakage, or process-specific fuel behavior can extend control time even when earlier stages appear acceptable.
Finally, evaluators should track consistency metrics such as average response time, worst-case response time, standard deviation, and performance drift across repeated tests. Variability is often more revealing than an acceptable average. A system with a good mean and poor repeatability is a risk signal, especially in facilities where any slow outlier could produce severe consequences.
What technical evaluators are really trying to determine
When professionals search for fire suppression response time metrics, they are usually not looking for abstract definitions. They want a defensible way to answer several operational questions. First, is the system fast enough for the hazard growth rate in this environment? Second, where exactly do delays occur? Third, are the delays random, condition-specific, or structural? Fourth, does current performance align with the facility’s risk tolerance and regulatory burden?
These questions are especially important in critical industrial settings because fire dynamics are rarely generic. A suppression sequence suitable for a standard commercial enclosure may be too slow for a lithium-related process zone, turbine auxiliary room, cleanroom chemical distribution area, or high-airflow electrical environment. Evaluators need timing data tied to actual hazard profiles, not generalized vendor assumptions.
They are also trying to judge whether the protection system remains robust under non-ideal conditions. Systems often perform well during commissioning and less well after operational changes. A modified partition wall, new ventilation pattern, altered rack layout, process contamination, or deferred maintenance interval can materially change suppression timing. Metrics provide an evidence base for detecting those changes early.
Common system gaps that response time data tends to uncover
One frequent gap is detector mismatch. A detector may meet specification but still be unsuited to the thermal signature, aerosol pattern, or airflow regime of the protected space. In that case, detection latency lengthens even though no component is technically broken. Response time data makes this visible because delays cluster in the earliest stage of the sequence.
Another common issue is overcomplicated release logic. To reduce false activations, facilities sometimes add multiple confirmations, cross-zone dependencies, manual intervention points, or supervisory approval steps. These may seem prudent in isolation, but together they can create a suppression timeline that is misaligned with actual fire growth. Evaluators should assess whether logic complexity is buying nuisance reduction at the cost of unacceptable incident delay.
Hydraulic or pneumatic inefficiency is another hidden gap. Long pipe runs, partial obstructions, pressure losses, poor nozzle balancing, or degraded cylinders may not be obvious during routine checks. However, they often appear as extended release-to-discharge times or uneven agent arrival at different nozzles. This matters greatly where local flame knockdown must occur before heat or smoke migrates into adjacent critical assets.
Maintenance drift also emerges clearly through metrics. Corrosion, contamination, sticking valves, aging actuators, sensor fouling, and calibration drift rarely create immediate total failure. More often, they add seconds incrementally. Because many organizations focus on whether the system still “works,” these slow degradations can go unnoticed until timing margins have already eroded below safe thresholds.
Finally, environmental interaction is a major source of performance gaps. High airflow, negative pressure, high ceilings, compartment leakage, process heat, and changing occupancy states can all alter suppression effectiveness. A system that reacts quickly during controlled testing may underperform in live operating conditions if the test setup did not reflect actual enclosure behavior or process-state variability.
How to evaluate whether the timing is acceptable for the hazard
The core evaluation principle is simple: response time must be judged against hazard development, not against isolated component specifications. A system can only be considered adequate if its end-to-end timeline is comfortably shorter than the escalation window for the protected risk. That means evaluators must understand both suppression timing and fire growth characteristics in the same analysis model.
For example, a delay that seems minor in a low-load storage area may be unacceptable in a process environment with fast ignition spread, high-value electronics, or severe smoke sensitivity. In some critical manufacturing environments, even a small suppression delay can trigger contamination, line shutdown, secondary damage, or regulatory reporting consequences far beyond direct fire loss.
Best practice is to establish benchmark thresholds for each protected zone rather than relying on one facility-wide metric. Different hazards require different tolerances. Electrical cabinets, turbine enclosures, solvent handling areas, clean chemical spaces, and server-intensive control rooms do not share the same acceptable response window. Zonal benchmarking helps evaluators distinguish between systems that are globally compliant and systems that are locally fit for purpose.
It is also important to evaluate margins, not just outcomes. If a system controls a fire only narrowly within an acceptable threshold under perfect conditions, then any modest drift may create failure exposure later. Strong systems show timing headroom across expected environmental and operational ranges. Weak systems pass only when assumptions remain ideal.
What good benchmarking looks like in a technical review
A useful benchmarking framework compares three layers of evidence. The first is design intent: what the system was supposed to achieve according to hazard analysis, code basis, and engineering specification. The second is commissioning performance: how the system behaved when new and validated. The third is current field performance: how it responds now under representative operating conditions.
When those three layers diverge, evaluators have a meaningful signal. If current response times are materially slower than commissioning values, there is likely maintenance drift, environmental change, or mechanical degradation. If commissioning results were already close to the limit, then the problem may be the original design basis rather than later decline.
Benchmarking should also compare repeated events under different scenarios. Test at varying airflow rates, occupancy modes, process states, and enclosure conditions where possible. If a system performs adequately only in one static condition, its real-world resilience is questionable. Repeatability under realistic variation is far more valuable than a single favorable test result.
For procurement and upgrade decisions, cross-system benchmarking is equally useful. Evaluators should compare not just nominal response times between suppliers, but also tolerance bands, failure modes, maintenance sensitivity, and diagnostic transparency. The better system is not always the one with the fastest headline number. It is often the one with the most stable performance envelope and the clearest evidence trail.
How to turn response time metrics into corrective action
Metrics only create value when they lead to targeted remediation. If detection latency is the main issue, likely actions include detector relocation, technology change, threshold tuning, contamination control, or revised zoning. If alarm-to-release delay dominates, the solution may involve control logic simplification, interlock redesign, or clearer automatic release criteria for high-speed hazards.
If release-to-discharge timing is weak, the priority shifts toward mechanical and distribution review. That may include valve testing, cylinder condition verification, line integrity checks, pressure analysis, nozzle inspection, or full hydraulic recalculation. If discharge occurs on time but suppression effect is slow, then the issue is often application engineering: agent suitability, discharge pattern, enclosure integrity, or interference from ventilation and process equipment.
Evaluators should also classify corrective actions by urgency. Some gaps indicate immediate life-safety or mission-continuity exposure. Others represent resilience erosion that can be addressed during planned shutdowns. A risk-ranked action plan helps technical teams communicate clearly with operations, procurement, EHS leadership, and insurers.
Documentation matters here. Response time findings should be logged in a way that supports future trend analysis, audit readiness, and supplier accountability. A one-time observation is useful; a time-series record is far more powerful. Over multiple review cycles, trends often reveal whether a facility is improving timing discipline or normalizing degradation.
Why this metric set matters for procurement, compliance, and resilience planning
For technical evaluators, response time analysis is not only an engineering exercise. It directly influences procurement quality, compliance confidence, and long-term resilience planning. Procurement teams need objective metrics to distinguish between systems that are merely certifiable and systems that are genuinely suitable for extreme or high-consequence environments.
From a compliance perspective, response time evidence strengthens defensibility. Regulators, insurers, internal auditors, and major clients increasingly expect more than installation records. They want proof that critical protection systems are effective under credible scenarios. Time-sequenced performance data provides exactly that kind of substantiation.
From a resilience standpoint, the benefit is broader. Fast, repeatable suppression response helps preserve production continuity, reduce collateral damage, limit shutdown scope, and protect adjacent high-value assets. In advanced manufacturing and energy infrastructure, the cost of delayed suppression often appears less in direct fire damage and more in process interruption, contamination, and cascading operational loss.
This is why fire suppression response time metrics should be treated as strategic reliability indicators. They reveal where a facility’s protective assumptions are strongest, where hidden fragility exists, and where investment will deliver the greatest reduction in operational risk.
Conclusion: the real signal behind the numbers
For technical evaluators, the most useful interpretation of fire suppression response time metrics is this: they show whether the protection sequence is truly aligned with the speed and complexity of the hazard. A compliant system may still contain dangerous delays. A well-documented system may still lack repeatability. And a fast-acting system may still fail if discharge does not translate into timely control.
The best evaluations therefore move beyond single-point acceptance criteria. They examine the full timeline from detection to effective suppression, test performance under realistic conditions, compare current results to design intent and commissioning baselines, and use variance as a signal of hidden weakness. That approach turns response time from a reporting metric into an operational decision tool.
In critical facilities, system gaps rarely announce themselves clearly. They appear first as extra seconds, unstable sequences, and shrinking safety margins. Organizations that measure those signals carefully are far better positioned to correct weaknesses early, strengthen regulatory readiness, and ensure their fire protection systems are engineered not just to comply, but to perform when failure is least tolerable.
Recommended News
 Sep 01, 2026What is driving Southeast Asia's fire safety market?Explore the fire safety market Southeast Asia: industrial growth, data centers, regulation, insurance, and digital monitoring are reshaping demand and investment opportunities.
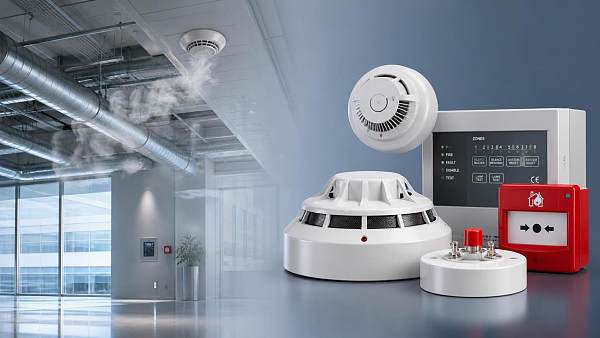
 Aug 26, 2026What drives smoke detector false alarm rates in EuropeSmoke detector false alarm rate Europe is shaped by technology, installation, environment, and maintenance. Discover what really drives nuisance alarms and how to reduce risk.
 Aug 21, 2026How to compare industrial fire protection systems in Europe by EN complianceIndustrial fire protection systems Europe: compare EN compliance, certification scope, hazard fit, integration, and lifecycle risk to choose a defensible, high-performance solution.
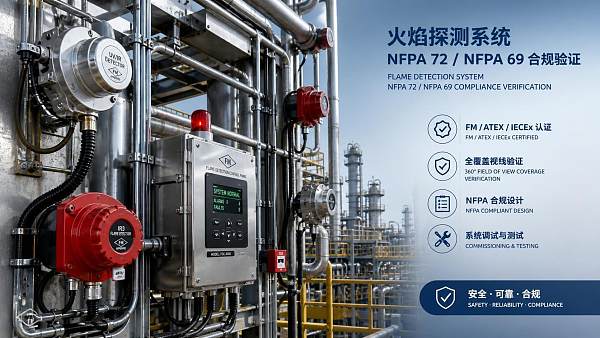
 Aug 20, 2026How to verify flame detection NFPA compliance before system approvalFlame detection NFPA compliance starts with proving design basis, certification, coverage, installation, testing, and records—learn the key checks to speed approval and avoid costly delays.

All Categories
Hot Articles
- How to select hazardous area protection for offshore oil and gas sitesSep 12, 2026Hazardous area protection oil and gas guide for offshore sites—select certified, durable solutions that meet zoning, temperature, cable-entry, and maintenance demands.
- What to verify before choosing an electronics industry solutions supplierSep 11, 2026Electronics industry solutions supplier checklist: verify engineering expertise, traceability, compliance, quality controls, supply resilience, and lifecycle support before you buy.
- How to verify a supplier’s SIL metrics before selecting gas detectorsSep 10, 2026SIL metrics supplier guide: learn how to verify certificates, FMEDA data, proof tests, and lifecycle support before selecting gas detectors for safety-critical SIFs.